
How to Choose a Sampling Method: Probability vs Non-Probability Sampling for Your Dissertation

I need to pick a sampling method, but should I select people at random or recruit whoever I can reach? Can I survey my course mates and still defend the results? What does “justify your sampling strategy” actually mean? How many participants is enough?
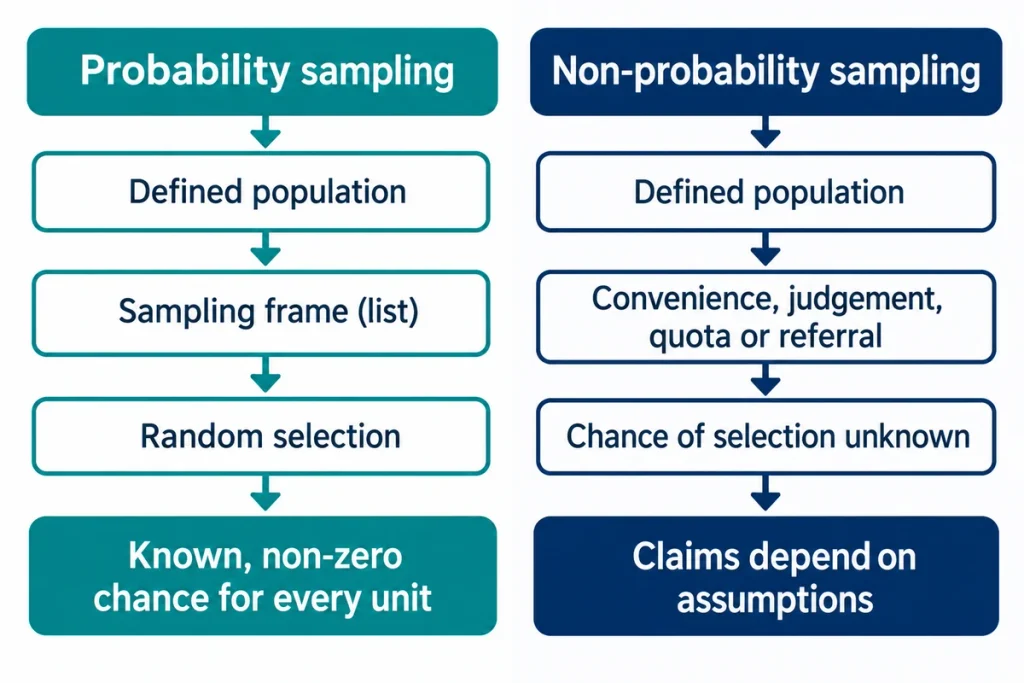
Probability vs non-probability sampling comes down to one thing: how people enter your sample. If a defined random process decides who is selected, and everyone in your sampling frame has a known, non-zero chance, it is probability sampling. If availability, judgement, volunteering or referral decides, it is non-probability sampling. Choose probability sampling when you must estimate something about a whole population. Choose non-probability sampling when depth, access or a hidden group matters more, and say plainly what your results can and cannot claim.
Probability vs Non-Probability Sampling: What Separates Them
A probability sample uses a random mechanism and gives every unit in the sampling frame a known, non-zero chance of selection. That known chance is what lets you estimate sampling error and build confidence intervals. A non-probability sample uses convenience, judgement, quotas, volunteering or referrals, so the chance of selection is unknown.
Some summaries say probability sampling needs an equal chance for everyone. That describes simple random sampling only. A stratified design can sample small groups at a higher rate and still count as probability sampling, because the rates are known and a random process applies them.
Two terms matter before you choose. The population is the whole group you want to say something about. The sampling frame is the actual list you draw from, such as an enrolment register or HR database. Any gap between the two creates coverage error, and a bigger sample does not repair it.
| Feature | Probability sampling | Non-probability sampling |
|---|---|---|
| How people are chosen | Random process on a defined frame | Convenience, judgement, quota, volunteering or referral |
| Chance of selection | Known and non-zero | Unknown |
| Sampling frame | Needed, or a staged design that builds one | Not needed |
| Statistical generalisation | Supported by the design | Needs extra modelling assumptions |
| Typical fit | Surveys that estimate population figures | Qualitative, exploratory or hard-to-reach groups |
| Main risk | Coverage gaps, nonresponse, cost | Selection bias you cannot measure |
Neither column guarantees quality. A 2020 review in the Journal of Survey Statistics and Methodology explains that statistical theory justifies confidence in probability designs, while conclusions from non-probability samples depend entirely on models. A random sample can still miss people through poor frames or nonresponse. A non-probability sample can still answer a qualitative question very well.
Sample size does not change the category either. Ten thousand volunteers still form a non-probability sample.
Which Sampling Method Should I Use? A Five-Question Decision Path
Work through these questions in order. Each answer removes options.
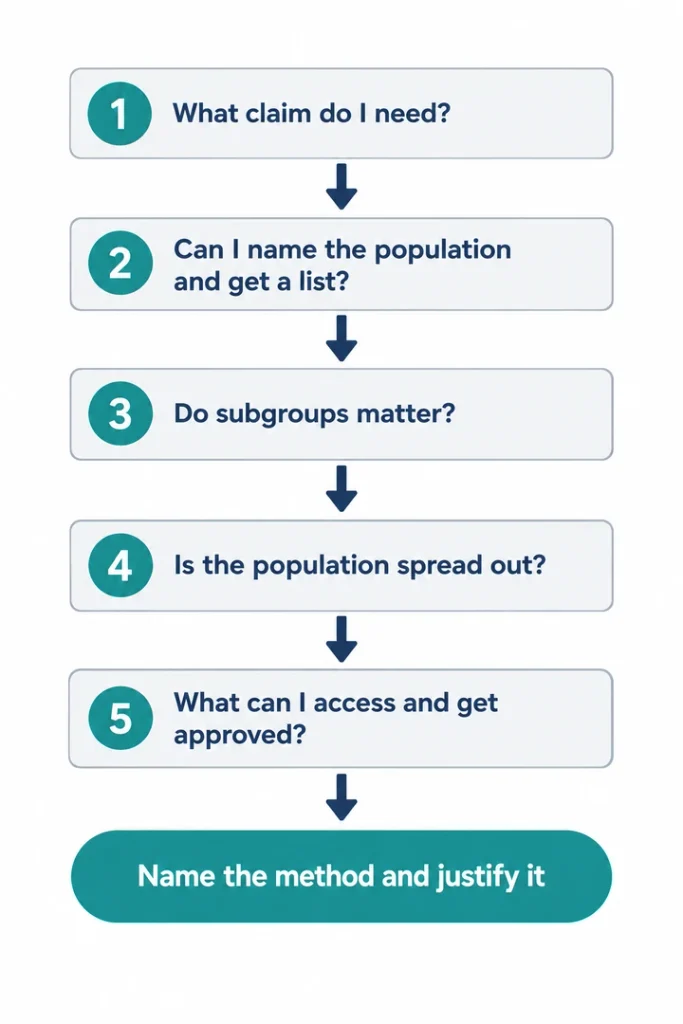
- What claim does your research question need? If you must estimate a percentage, mean or relationship for a defined population, aim for probability sampling. If you want to explore experiences or build understanding, purposive sampling usually fits better. Your answer should match the approach you set out when choosing a research methodology.
- Can you name the population and obtain a list? A usable frame makes simple random, systematic or stratified sampling possible. Without one, consider a staged design that samples places or organisations first. If no staged design is realistic, use a non-probability method and label it honestly.
- Do subgroups matter? If you must compare years of study, departments or regions, stratify. Stratified sampling is the random version. Quota sampling is the non-random one.
- Is the population spread out? Cluster or multistage sampling saves travel and cost, at the price of more sampling error.
- What can you actually access and get approved? A small, well-drawn probability sample often beats a large convenience sample. If your university only allows one cohort, justify that limit. Check your ethics route early, because recruitment methods need approval, and the guide on getting ethics approval covers the steps.
Types of Probability Sampling: Simple Random, Systematic, Stratified and Cluster
The examples below use one imaginary university with 6,400 undergraduates and a complete enrolment register. The numbers are illustrative, not real data.
Simple Random Sampling
Number every student on the register, then draw numbers with a random number generator. Every student has the same chance of selection. It is easy to explain and analyse, but it needs a full list, and chance alone can under-represent small subgroups.
Systematic Sampling
Pick a random starting point, then select every kth name. The interval is k = N ÷ n. With 6,400 students and a target of 363, 6,400 ÷ 363 = 17.6. Round down to 17 so you do not fall short, which gives about 376 students.
The risk is a hidden pattern. If the register lists students in a repeating order that matches your interval, the sample can skew. Systematic sampling also only counts as probability sampling when the start is random and the frame covers the population. Taking every tenth person who walks past does not qualify.
Stratified Sampling
Split the register into strata, then sample randomly within each one. Suppose Year 1 has 2,560 students, Year 2 has 2,240 and Year 3 has 1,600. A proportionate sample of 363 takes 145, 127 and 91 students respectively. Every year group is represented in the right proportion.
Use stratification when your research question compares subgroups. You need the stratifying variable on the frame before you start.
Cluster and Multistage Sampling
Cluster sampling selects whole groups at random, such as three of ten campuses, then surveys everyone in them. Multistage sampling adds further random stages inside the chosen clusters. Both cut cost for dispersed populations. Both raise sampling error when clusters differ from one another.
A real UK example shows the idea at scale. The Office for National Statistics selects addresses at random from Royal Mail’s Postcode Address File for the Crime Survey for England and Wales. The address list is the sampling frame, and the random draw gives each listed address a known chance of selection.
| Method | Needs | Strength | Watch for |
|---|---|---|---|
| Simple random | Full frame | Simple, unbiased selection | Small subgroups missed by chance |
| Systematic | Ordered frame, random start | Fast and evenly spread | Hidden patterns in the list |
| Stratified | Strata known on the frame | Precision, subgroup coverage | Extra admin; weights if rates differ |
| Cluster / multistage | List of clusters | Lower fieldwork cost | Higher sampling error |
Types of Non-Probability Sampling: Convenience, Purposive, Quota and Snowball
Convenience Sampling
You recruit whoever is easiest to reach, such as classmates or people in your own social groups. It is fast and cheap, and it suits pilot testing. It cannot support claims about a wider population, because the easy-to-reach rarely mirror everyone else.
Voluntary Response Sampling
People volunteer themselves, for example by answering an open online survey. Volunteers tend to hold stronger opinions than non-volunteers, so results lean one way.
Purposive (Judgement) Sampling
You select people because they meet clear criteria linked to your question, such as primary school headteachers with five or more years in post. It is the standard choice for qualitative work, where the goal is rich detail rather than statistical inference. Papers that compare purposive and convenience sampling, such as Etikan and colleagues (2016), conclude that the right choice depends on the nature of the research. Purposive sampling needs stated criteria and a reason for each. Without them it collapses into convenience sampling.
Quota Sampling
You set targets for subgroups, for example 50 men and 50 women, then fill them by any convenient route. The targets control the sample’s make-up, but selection inside each quota is not random. That is the key difference from stratified sampling.
Snowball Sampling
Early participants introduce further participants. It reaches hidden or stigmatised groups where no list exists. The sample stays inside one network, and early participants shape who follows. A specialised variant called respondent-driven sampling uses structured recruitment and statistical models, but its estimates rest on assumptions that are hard to verify.
One common trap deserves a warning. Opt-in online panels and survey platforms often draw from volunteer pools, which makes them non-probability sources. The American Association for Public Opinion Research (AAPOR) task force on non-probability sampling (Baker and colleagues, 2013) advised avoiding claims of representativeness for opt-in panels and stressed transparency about how the sample was built.
Which Sampling Method Fits My Dissertation Design? Four Common Scenarios
These are illustrative cases. Adapt them to your own population, ethics approval and supervisor’s advice.
- Survey of one organisation with a staff list. Stratified random sampling by department works, provided the organisation shares the list. Match it to the questionnaire you build using the guide to designing the questionnaire.
- Interviews with practising professionals. Purposive sampling with written inclusion criteria fits. Consider recruiting across different settings to capture variety. Plan the schedule using the notes on semi-structured interview design.
- A hard-to-reach group. Snowball sampling is often the only workable route. State the network bias as a limitation and treat ethics with extra care, because participants may be vulnerable or identifiable.
- Existing survey data. Someone else already chose the sampling design. Read the technical report, note the frame and any weights, and describe them accurately. The comparison of primary versus secondary research explains when this route suits you.
Can I Use Non-Probability Sampling in a Dissertation?
Yes. Non-probability sampling is widely accepted, particularly in qualitative and exploratory studies and where no sampling frame exists. Three habits keep it defensible:
- Name the method accurately and explain why it fits your question.
- Avoid words such as “representative” or “generalisable” unless your design supports them.
- List the bias it brings as a limitation, with the direction it may push your findings.
Statistical tests need extra care. Software will run a test on a convenience sample, but the usual reading of a p-value assumes random selection. Ask your supervisor how your department expects tests on non-random samples to be reported, then pick the test using the statistical test selector.
Do not confuse random sampling with random assignment. Random sampling decides who enters the study. Random assignment decides which condition each participant receives. An experiment can use volunteers and still randomise them to groups, but the findings then cannot be generalised beyond the recruited volunteers without further justification.
How Big Should My Sample Be? Sample Size for Quantitative and Qualitative Studies
Quantitative Surveys: Cochran’s Formula
To estimate a proportion in a large population, the standard formula is n = z² × p(1 − p) ÷ e². With 95% confidence (z = 1.96), the most cautious proportion (p = 0.5) and a ±5% margin of error:
- 1.96² × 0.5 × 0.5 = 0.9604
- 0.05² = 0.0025
- 0.9604 ÷ 0.0025 = 384.16, which rounds up to 385
For a known, smaller population, apply the finite population correction: n = n₀ ÷ (1 + (n₀ − 1) ÷ N). With N = 6,400, the 385 becomes 363. With N = 1,000 it falls to 278.
Then allow for nonresponse. If you expect 40% of invited students to reply, 363 ÷ 0.4 means inviting about 908. The 40% is an assumption, so base yours on a pilot or a similar study.
Two limits apply. This formula estimates a single proportion, so a study comparing groups needs a power analysis instead. A tighter margin also costs far more: ±10% needs about 97 responses, while ±3% needs about 1,068. The free sample size calculator handles the arithmetic.
Qualitative Studies: Saturation and Information Power
No formula exists for interviews. Guest, Bunce and Johnson (2006) found that, in their data from 60 interviews with women in two West African countries, saturation occurred within the first 12 interviews. Hennink and Kaiser’s 2022 systematic review of 23 studies reported that empirical tests typically reached saturation within 9 to 17 interviews or 4 to 8 focus groups, with findings applying best to fairly homogeneous samples.
Treat those figures as evidence, not rules. Malterud and colleagues (2016) argue that the number depends on information power: the aim of the study, how specific the sample is, use of established theory, quality of dialogue and analysis strategy. Braun and Clarke (2021) go further, arguing that saturation does not fit reflexive thematic analysis, because decisions about when to stop are situated and cannot be fully fixed in advance. If you use that approach, the guide to thematic analysis shows how to justify your sample on those terms.
Bigger Does Not Mean Better
Meng (2018) analysed a 2016 US election survey and estimated that a self-reported sample of about 2.3 million had the same error as a genuine random sample of roughly 400 for the question studied. Data quality set the limit, not data quantity.
Sampling Bias, Coverage Error and Nonresponse: Where Good Samples Go Wrong
Coverage error happens when part of the population is missing from your frame. Nonresponse happens when sampled people do not reply. They need different fixes, and both can hit a probability sample.
The 1936 Literary Digest poll shows both at once. It mailed about 10 million ballots to names drawn mainly from telephone and car registration lists. Roughly 2.4 million came back and predicted a Landon victory. Roosevelt won with about 61% of the vote. The frame leaned towards wealthier households, and those who replied differed from those who did not.
A UK example shows volunteer bias in a very large study. UK Biobank invited about 9.2 million people and about 5.5% took part. Fry and colleagues (2017) found participants were less likely to be obese or smoke and had fewer health conditions than the general population. The authors also noted that valid exposure-disease comparisons may not need a representative sample. A skewed sample limits some claims and leaves others intact.
Weighting can adjust for imbalances you have measured, such as age and gender. It cannot correct for differences you never measured.
Sampling Mistakes That Weaken a Methodology Chapter
- Calling a convenience sample “random” because the survey was shared widely.
- Treating the population and the sampling frame as the same thing.
- Choosing a sample size by rule of thumb instead of calculating or justifying it.
- Citing “saturation” without saying how you judged it.
- Claiming generalisability from a purposive or snowball sample.
- Ignoring nonresponse and not reporting how many people actually took part.
- Describing the method by its label and not by what you did.
How to Write Your Sampling Strategy in the Methodology Chapter
Report what you did, in this order:
- The target population and why you defined it that way.
- The sampling frame or recruitment route, and any gaps in it.
- The method, named precisely, with the reason it suits your question.
- Inclusion and exclusion criteria.
- Sample size, with the calculation or the qualitative justification.
- How you recruited, how many agreed, and how many completed.
- The limits this creates for your claims.
Two sentence frames show the tone. Replace the brackets with your own details.
- Probability design: “A proportionate stratified random sample of [n] students was drawn from the university’s enrolment register of [N], stratified by year of study; [x] responded.”
- Purposive design: “Participants were selected purposively against three criteria: [criteria]. Recruitment continued until [stated judgement of adequacy, with source].”
The wider structure sits in the guide to writing the methodology chapter.
Frequently Asked Questions About Probability and Non-Probability Sampling
Why choose non-probability sampling?
Choose it when no sampling frame exists, the group is hidden or small, the aim is depth rather than population estimates, or time and access are tight. Justify the choice and state its limits.
What are the disadvantages of non-probability sampling?
Selection bias is unknown and cannot be measured from the design. You cannot calculate design-based sampling error. Generalisation is weak. Purposive sampling can reflect the researcher’s judgement, and snowball samples stay within one network.
What are the limitations of probability sampling?
It needs a good frame and usually costs more time and money. Coverage gaps and nonresponse still bias results. Cluster designs raise sampling error. A random sample can also differ from the population by chance.
What is the difference between stratified and quota sampling?
Both fix subgroup shares in advance. Stratified sampling then selects randomly within each subgroup from a frame, so it is probability-based. Quota sampling fills the same targets by convenience, so it is not.
Does sharing my survey in random groups count as probability sampling?
No. Choosing where to post at random does not give each person in the population a known chance of selection. People still decide for themselves whether to see and answer it.
Choosing Your Sampling Method: Next Steps
Write your sampling decision in one sentence before you write anything else, for example: “I will use [method] because [question] needs [claim].” If the sentence will not come, revisit the research question. The choosing a statistical test guide shows how sampling choices carry into analysis.
If your supervisor has queried your sampling section and you want an expert second pair of eyes, methodology chapter support can review the design and the wording. Use any reference material according to your institution’s policy.
Sources Behind the Figures
- Baker, R. et al. (2013). Summary Report of the AAPOR Task Force on Non-probability Sampling. Journal of Survey Statistics and Methodology, 1, 90-143.
- Braun, V. and Clarke, V. (2021). To saturate or not to saturate? Qualitative Research in Sport, Exercise and Health, 13(2), 201-216.
- Cornesse, C. et al. (2020). A review of conceptual approaches and empirical evidence on probability and nonprobability sample survey research. Journal of Survey Statistics and Methodology, 8(1), 4-36.
- Etikan, I., Musa, S. A. and Alkassim, R. S. (2016). Comparison of convenience sampling and purposive sampling. American Journal of Theoretical and Applied Statistics, 5(1), 1-4.
- Fry, A. et al. (2017). Comparison of sociodemographic and health-related characteristics of UK Biobank participants with those of the general population. American Journal of Epidemiology, 186(9), 1026-1034.
- Guest, G., Bunce, A. and Johnson, L. (2006). How many interviews are enough? Field Methods, 18(1), 59-82.
- Hennink, M. and Kaiser, B. N. (2022). Sample sizes for saturation in qualitative research: a systematic review of empirical tests. Social Science & Medicine, 292, 114523.
- Malterud, K., Siersma, V. D. and Guassora, A. D. (2016). Sample size in qualitative interview studies: guided by information power. Qualitative Health Research, 26(13), 1753-1760.
- Meng, X.-L. (2018). Statistical paradises and paradoxes in big data (I). Annals of Applied Statistics, 12(2), 685-726.