
How to Operationalise Variables in Your Dissertation: From Vague Concept to Measurable Indicator

Your supervisor asks how you will measure “engagement”, “stress” or “customer loyalty”, and you realise you cannot point to any of them. Learning how to operationalise variables solves that problem. It turns an idea you cannot observe into something you can record, score or count.
Before you start, a few questions are probably on your mind:
- How is a concept different from a variable, and where do indicators fit?
- Can I borrow a questionnaire from an earlier paper, or must I design my own?
- Does a score from 0 to 40 count as continuous, or should I split it into low and high?
- How much of this belongs in my methodology chapter?
The short answer is this. To operationalise a variable (or “operationalize”, in US spelling), you decide exactly how the concept will be observed or measured in your study. Then you write that decision down so another researcher could repeat it. A student guide in the Indian Journal of Psychological Medicine describes this as defining a variable in a way that permits accurate measurement.
The process matters most in quantitative and mixed-methods dissertations, where variables become numbers or categories. If your project is purely interpretive, start with the guide to choosing a research methodology and ask your supervisor which parts apply to you.
What does it mean to operationalise a variable?
Researchers move through three layers. A concept is the abstract idea, such as perceived stress. A variable is the property of that concept you choose to study, such as how stressful participants find their lives over the last month. An indicator is the concrete measure that stands in for the variable, such as a total score on a questionnaire. Operationalisation is the work of moving from the first layer to the third. Our guide to how to do content analysis for a dissertation walks through it step by step.
A conceptual definition says what a term means in theory, whereas an operational definition says how you will measure it in this study. You need both. Without the first, readers cannot tell what you mean by stress. Without the second, they cannot tell what your numbers represent.
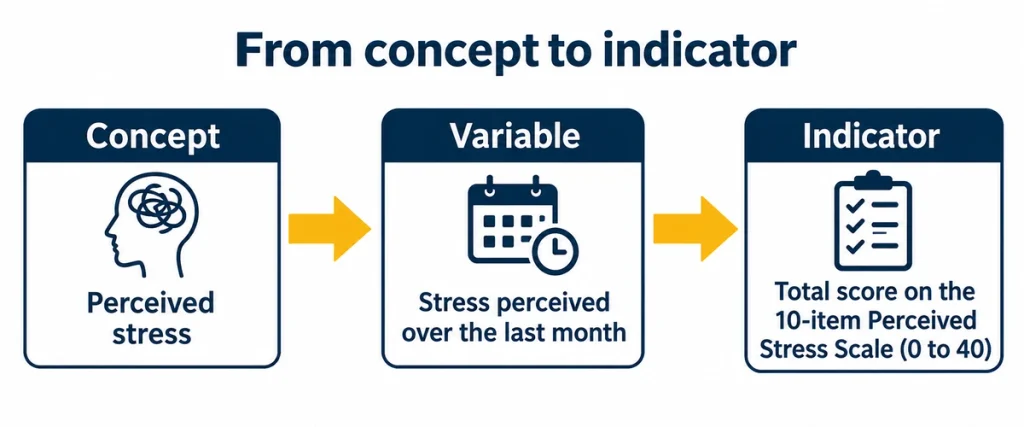
The same logic covers every kind of variable. Independent variables, dependent variables and, in correlational designs, co-variables all need an operational definition. It also matters for your findings, because two studies of the same concept can reach different results when they measure it differently.
How to operationalise variables in five steps
Work through the steps in order. Each one gives you a sentence you can reuse in your methodology chapter.
Step 1: Define the concept using your literature review
Start from your research question. If the question is still loose, the guide to writing a research question will sharpen it before you go further. Then write a conceptual definition drawn from theory and earlier studies. This often reveals that the concept has several dimensions. Wellbeing, for instance, can include life satisfaction as well as a sense of purpose.
Step 2: Choose the dimension and name the variable
Pick the dimension that fits your question and sample, then name the variable precisely. Student engagement could mean hours spent studying, attendance at seminars or participation in discussion. Each of those is a different variable, and each leads to a different measure.
Step 3: Check how earlier studies measured it
Read the methods sections of the papers in your literature review. Note which instrument each study used, how many items it had and how responses were scored. An established measure links your work to existing evidence, so it needs less defending than a new one.
Step 4: Choose the indicator and the scoring rule
An indicator can be a questionnaire score, a count of behaviours, a database record, a physiological reading or an observer rating. Whichever you pick, decide how responses become a number or category and what a higher value means. Where practical, measure the same variable in two ways. If your results hold across both measures, they are described as robust.
Step 5: Write the operational definition so someone else could repeat it
Name the instrument or procedure, the number of items, the response scale, the scoring method, the meaning of scores and the source. Then apply a simple test: could another researcher repeat your measurement from your description alone? If not, add detail.
A worked example: perceived stress and weekly paid work
Imagine this research question, invented for illustration: is the number of hours undergraduates spend in paid work each week related to how stressed they feel? Both variables need operational definitions.
Start with the dependent variable. In the work of Cohen and colleagues, perceived stress is the degree to which people see their lives as unpredictable, uncontrollable and overloading. The Perceived Stress Scale was published by Cohen, Kamarck and Mermelstein in 1983, and a 10-item version, the PSS-10, is widely used in research. In a methodology chapter, the operational definition might read like this:
Perceived stress was measured with the 10-item Perceived Stress Scale (PSS-10; Cohen, Kamarck and Mermelstein, 1983). Participants rate how often they felt or thought a certain way during the last month, from 0 (never) to 4 (very often). The four positively worded items (items 4, 5, 7 and 8) are reverse scored before all ten items are summed, giving a total from 0 to 40. Higher totals indicate higher perceived stress.
The independent variable needs the same precision. You might define weekly paid work as the number of hours a participant reports working for pay in a typical term-time week, recorded as a whole number. You would also state whether placements, volunteering and unpaid internships count. Those small decisions are what make a definition repeatable.
Putting both variables into a table keeps the logic visible from concept to data.
| Variable | Conceptual definition | Operational measure | Coding | Higher value means |
|---|---|---|---|---|
| Perceived stress | The degree to which life is appraised as unpredictable, uncontrollable and overloading | Total score on the PSS-10 | Items 4, 5, 7 and 8 reversed, then ten items summed (0 to 40) | Greater perceived stress |
| Weekly paid work | Time spent working for pay during term | Self-reported hours in a typical term-time week | Whole hours, entered as a number | More time in paid work |
Check permissions before you use any published scale. Some instruments are free for research use, while others need a licence, so read the publisher’s terms before you copy items into your questionnaire.
Independent, dependent and confounding variables: what each one needs
An independent variable influences the value of other variables, while a dependent variable is influenced by them. A hypothesis states the expected relationship between the two, so your operational definitions should match the wording of your hypotheses. If those statements are still taking shape, the guide to developing hypotheses from your literature review shows how to build them. The hypothesis builder then gives you a structured way to draft each statement.
Confounding variables deserve the same care. In an observational study of two-wheeler accidents, riders wearing helmets appear less likely to die. Yet people who are careful by nature may both wear helmets and ride more safely, so carefulness could explain part of that pattern. Because a confound can inflate, hide or even create a relationship, decide which ones matter before you collect data. Afterwards, it is too late to measure a missing one.
Mediators and moderators need ordinary operational definitions too. You must be able to capture each construct on its own before you test its role in a relationship.
Categorical or continuous: choosing the measurement level
A categorical variable is recorded as categories and reported as counts, such as employed or not employed. A continuous variable is recorded as a number for each participant, such as age or a total scale score. The level you choose determines which summaries and tests make sense, so decide it from how the variable is defined and collected, not from what your software suggests.
Categories must be mutually exclusive and meaningful for your question. When you are ready to match levels to tests, the statistical test selector narrows your options. The reasoning behind those options is explained in the guide to choosing a statistical test.
Avoid splitting a continuous score into groups without a reason. Andrade lists the costs: you lose precision, similar participants land in different groups, the boundaries are arbitrary and statistical significance becomes harder to reach. Sleep research shows the choice clearly. The Pittsburgh Sleep Quality Index (Buysse et al., 1989) produces a global score from 0 to 21, and many studies treat scores above 5 as poor sleep. Keeping the full score preserves detail that a good-sleeper versus poor-sleeper split would throw away.
Even so, splitting can be justified. Examples include a guideline that requires categories, participants who cannot report exact values, a non-linear relationship, heavily skewed data, or a need to calculate odds ratios. If you do split, say why. Equally, do not merge small groups just to make a test easier to run.
Established scale or your own measure?
Use an established scale when one fits. It connects your work to earlier findings and comes with evidence about how it behaves. However, check the original items, the scoring and the groups it was tested on, because a scale built for one population may not suit another. Avoid changing wording, response options or item numbers casually, since adaptation can alter what the scale measures.
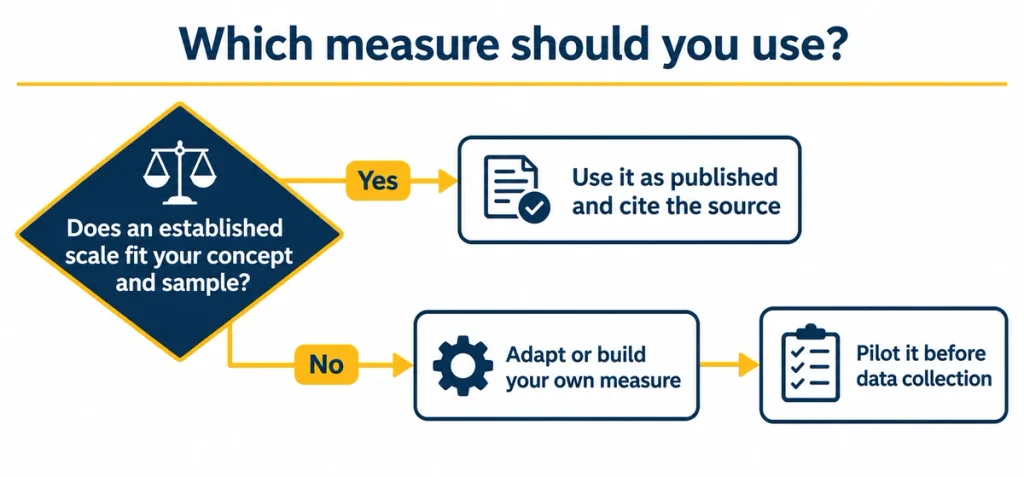
Build your own measure only when nothing suitable exists, and lean on the guide to writing a dissertation questionnaire for item wording. Then pilot it with a small group before the main study. The same advice applies to modified or translated scales. A pilot shows whether participants read each item the way you intended, and the small dataset lets you rehearse your analysis.
Reliability and validity: does your operational definition work?
A clear definition is not automatically a good one. Reliability is about consistency, meaning whether the measure gives the same results under the same conditions. Validity is about accuracy, meaning whether it captures the concept it claims to. Construct validity is the formal check that your operationalisation measures what you say it does. If you are unsure how to approach this, read our guide to how to check reliability and validity.
For multi-item scales, report Cronbach’s alpha from your own sample, not only the figure in the original paper. Tavakol and Dennick’s explanation of Cronbach’s alpha notes that alpha runs from 0 to 1 and depends on the number of items and how many concepts they cover. They also report that acceptable values range from 0.70 to 0.95, and that a value above 0.90 may signal redundant items. If a scale covers more than one concept, calculate alpha for each concept rather than for the whole scale.
Alpha is only one check. Also ask whether the measure matches your conceptual definition, whether another researcher could repeat it, whether it has precedent in your field, whether you have the resources to use it and whether it suits your participants.
Limits of operationalisation and how to write about them
No measure captures a concept completely. Three limits are worth naming:
- Context changes meaning. The income level that counts as poverty differs between countries, so one fixed definition may not travel.
- Numbers can miss meaning. A five-point satisfaction rating shows how satisfied someone is, but not why.
- Different measures hinder comparison. Corruption, for example, can be measured through perceptions of business practice or through how often bribes are requested, and the two may not reflect the same thing.
Report your variables and indicators in the methodology chapter, as the guide to writing a dissertation methodology explains. Then, in the discussion, consider how your choice of measure may have shaped the results, a step covered in the guide to the dissertation discussion chapter. Finally, match your conclusions to your measure. A single question about savings cannot support broad claims about financial wellbeing.
Common mistakes when you operationalise variables
- Leaving the measure implicit. Name every instrument and say how it is scored.
- Treating a name as a definition. “Wellbeing” is a concept, not a measure. State the scale or procedure that stands in for it.
- Skipping the justification. Explain why you chose this measure over the alternatives.
- Using a scale outside its tested context. Report its reliability in your own sample.
- Squeezing a complex construct into one question. Complex constructs often need several indicators, and theory should guide the decision.
- Overclaiming from a narrow measure. Keep conclusions within what the measure can show.
- Collapsing categories for convenience. Merge groups only when the research question supports it.
Check your variable table before collecting data
Build a table like the one above for every variable you plan to analyse, and place it beside your questionnaire. Each row should let a reader see how a concept became data. Ask your supervisor to review it at this stage, because information you fail to collect cannot be added later. A quick check helps:
- Does each operational measure match its conceptual definition?
- Could another researcher repeat the measurement from your description?
- Are the scoring direction and coding written down?
- Does the measurement level support the test you plan to run?
- Have you recorded the source and any permission needed?
Need a second opinion on your variable table? You can get dissertation methodology help to check how your variables, instruments and planned analysis fit together before data collection begins. Support of this kind is meant for reference and learning, and any work should be used according to your institution’s policy.
Frequently asked questions about operationalising variables
Is an operational definition the same as a hypothesis?
No. A hypothesis states the relationship you expect between variables. An operational definition explains how each of those variables will be measured.
What is the difference between operationalisation and measurement?
Operationalisation is the decision about how to measure a concept. Measurement is the act of applying that decision to collect data. The first comes before the second, and it is the more consequential choice because it determines what the data actually capture.
Can I define a variable differently from earlier studies?
Yes, provided you explain why your measure fits your context and discuss any adaptations or limitations. A new or heavily adapted measure needs more justification and validation than an established one.
Do I have to operationalise every variable?
Every variable you analyse should be defined clearly enough for readers to understand what was measured and how. Simple variables such as age may need only a short note, whereas abstract ones need the full treatment.
References
- Andrade, C. (2021). A student’s guide to the classification and operationalization of variables in the conceptualization and design of a clinical study: Part 2. Indian Journal of Psychological Medicine, 43(3), 265-268.
- Buysse, D.J., Reynolds, C.F., Monk, T.H., Berman, S.R. and Kupfer, D.J. (1989). The Pittsburgh Sleep Quality Index: a new instrument for psychiatric research and practice. Psychiatry Research, 28, 193-213.
- Cohen, S., Kamarck, T. and Mermelstein, R. (1983). A global measure of perceived stress. Journal of Health and Social Behavior, 24(4), 385-396.
- Tavakol, M. and Dennick, R. (2011). Making sense of Cronbach’s alpha. International Journal of Medical Education, 2, 53-55.