
How to Check Reliability and Validity: Tests, Thresholds and Write-Up for Your Dissertation

I have built a measure for my dissertation. Now I need to know how to check reliability and validity: do I have to prove both? Which statistic fits my data, and what value is good enough? Does any of it apply if I am running interviews instead of a survey?
The answer changes with what you measure: scale items, repeated scores, rater judgements or qualitative themes. In short, reliability asks whether a measure behaves consistently, and validity asks whether it measures the right thing. Reliability usually earns a statistic. Validity earns a body of evidence.
Most checks below suit quantitative measures such as scales, tests and coded observations. Interviews and thematic analysis get their own section, because alpha and kappa do not always belong there. Where sources disagree on a threshold, the text says so.
How to check reliability and validity: pick the check that fits your measure
Start from what you collected, then choose the matching check. The table pairs seven common situations with a reliability check and the validity evidence an examiner expects to see. Our guide on how to calculate sample size for a dissertation goes into more detail.
| What you are using | Reliability check | Validity evidence |
|---|---|---|
| A published scale, used exactly as written | Recalculate alpha (or omega) in your own sample, per subscale | Cite the original validation studies and say how your sample differs |
| A published scale you shortened, reworded or translated | Recalculate per subscale; add test-retest if you can | Treat earlier validation as unconfirmed for your version and gather your own evidence |
| A questionnaire you wrote yourself | Pilot first, then alpha per subscale in the main sample | Expert panel for content, factor analysis for structure, correlations with related measures |
| Observations or open answers coded by people | Cohen’s kappa (two raters), Fleiss’ kappa (three or more) or ICC for continuous ratings | A coding frame built from theory and reviewed by experts |
| The same measure given twice to the same people | Test-retest reliability with ICC, gap between occasions stated | None on its own: consistency says nothing about accuracy |
| A test compared with a gold standard (clinical or diagnostic) | Test-retest or inter-rater, as above | Sensitivity, specificity, ROC curve and AUC (criterion validity) |
| Interviews, focus groups or reflexive thematic analysis | Dependability: an audit trail of decisions | Credibility and transferability: triangulation, member checking, thick description |
If you are still at the design stage, building a dissertation questionnaire covers how to write items that are easier to defend later. When you are not sure a measure-based design suits your question at all, choosing a research methodology helps you decide.
Reliability vs validity: how they relate and which comes first
Reliability is consistency. Validity is accuracy. UK university library guidance frames both as the way you show rigour in quantitative work (Sheffield Hallam University, n.d.).
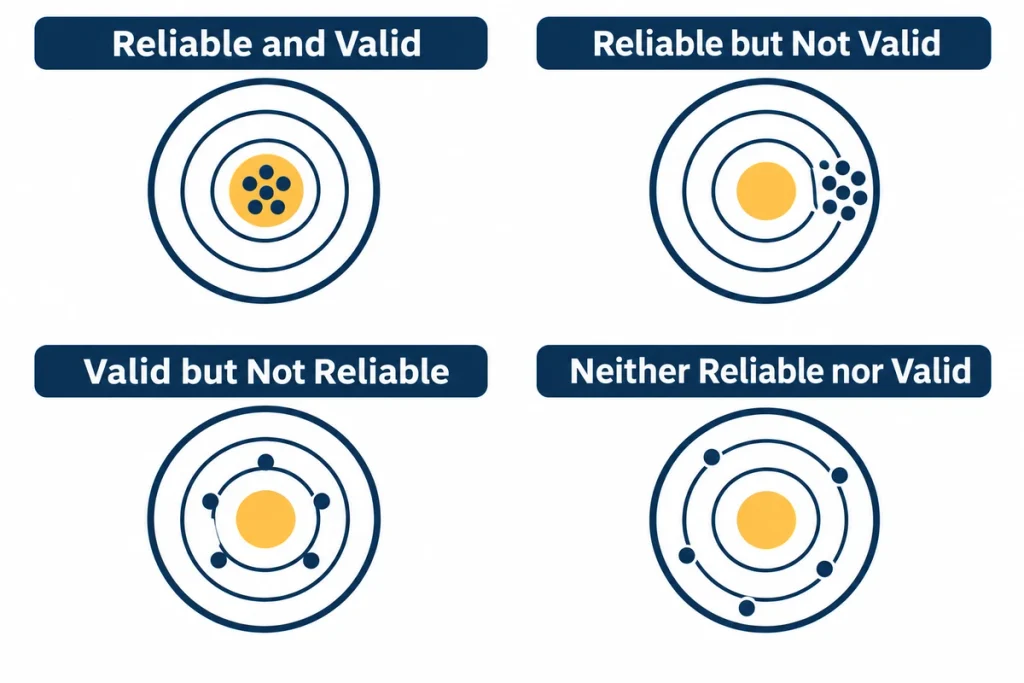
A measure can be consistent and wrong. An alarm clock that rings at 7:00 every morning but was set for 6:30 is perfectly reliable and invalid (Heale and Twycross, 2015). The reverse does not hold. If scores jump around for no reason, they cannot track a stable construct accurately, so reliability is necessary for validity but never enough on its own (Morrison, 2019).
In practice, the order runs like this. Define the construct and plan content validity at the design stage. Test reliability in a pilot. Then gather construct and criterion evidence once your main data exist.
How to test reliability: four methods and the statistic for each
Four routes cover almost every dissertation: internal consistency, test-retest, inter-rater and parallel forms (Sauro, 2015). Each answers a different worry, so match the method to the source of inconsistency you fear: the items, the occasion, the rater or the version.
Internal consistency: Cronbach’s alpha, omega and what a good value looks like
Internal consistency asks whether the items in one scale hang together. Cronbach’s alpha is the usual statistic because a single administration is enough to calculate it.
Published guidance on acceptable values runs from 0.70 to 0.95, and a value above 0.90 may signal redundant items rather than a better scale (Tavakol and Dennick, 2011). Taber (2018) goes further: a fixed cut-off such as 0.70 is arbitrary, and alpha rises simply by adding items, even weak ones. Treat 0.70 as a convention, then interpret your number against the length and purpose of the scale.
Three habits keep alpha honest:
- Calculate it for each subscale, not for the whole instrument. Mixing several constructs inflates the value (Tavakol and Dennick, 2011).
- Recalculate it in your own sample instead of quoting the original paper. Alpha describes one administration, not the scale for all time (Tavakol and Dennick, 2011; Taber, 2018).
- Do not read a high alpha as proof of one dimension. Internal consistency is necessary but not sufficient for unidimensionality, so use factor analysis for that question (Tavakol and Dennick, 2011).
Alpha also assumes every item relates equally well to the underlying construct. When items differ in strength, alpha underestimates reliability (Tavakol and Dennick, 2011). McNeish (2018) argues for alternatives such as McDonald’s omega and supplies R code for them. The gap between alpha and omega is often small but can be substantial when the assumptions are badly violated (Stensen and Lydersen, 2022). If your supervisor expects alpha, report it, and ask whether omega should sit beside it.
Cronbach’s alpha in SPSS: a step-by-step walkthrough
- Reverse-code any negatively worded items first. A negative alpha usually means some items point the other way (Sauro, 2015).
- Choose Analyze, then Scale, then Reliability Analysis. Move the items of one subscale into the Items box and leave the model on Alpha. Menu wording can differ slightly between SPSS versions.
- Open Statistics and tick Item, Scale and Scale if item deleted under Descriptives for. Without the last option you only get the overall coefficient.
- Read the Reliability Statistics table for alpha, then the Item-Total Statistics table for each item.
- Scan the Corrected Item-Total Correlation column. A negative value points to a reversal problem, and many tutorials flag values below about .30 as weak.
- Compare each Alpha if Item Deleted value with the overall alpha. If one is higher, that item may be dragging the scale down. Remove one or two items at a time, re-run the analysis, and drop an item only when it is also weak conceptually. In one published worked example, a six-item scale scored 0.866 and rose to 0.893 once its weakest item went (Morrison, 2019).
- Repeat for every subscale, and record the number of items, the number of respondents and each alpha.
Test-retest reliability: ICC, the retest gap and what to report
Test-retest reliability checks whether the same people give similar scores on two occasions. It suits stable constructs such as traits and long-held attitudes. It suits changeable states such as mood poorly, because a low correlation may reflect real change rather than a faulty measure.
The gap between occasions is a design decision. A short gap invites memory effects that flatter the result, while a long gap lets genuine change pull it down (Morrison, 2019). Retest intervals often lack an evidence base (Polit, 2014), so choose a gap that matches how quickly your construct changes, justify it, and report it.
For the statistic, a Pearson correlation alone is a weak choice. It reflects correlation but not agreement, so scores that all rise by ten points at retest would still correlate perfectly. The intraclass correlation coefficient (ICC) captures both (Koo and Li, 2016).
Koo and Li suggest labelling results by the 95% confidence interval rather than the point estimate: below 0.50 is poor, 0.50 to 0.75 moderate, 0.75 to 0.90 good and above 0.90 excellent. State which ICC form you used, because the model, type and definition change the number.
Inter-rater reliability: Cohen’s kappa, ICC and percent agreement
Use inter-rater reliability when people judge, code or score the same material. Percent agreement is easy to calculate but ignores agreement that happens by chance. Cohen’s kappa corrects for it (McHugh, 2012).
Pick the statistic by data type. Cohen’s kappa suits two raters and categories. Fleiss’ kappa extends the idea to three or more raters (McHugh, 2012), weighted kappa suits ordered categories, and the ICC suits continuous ratings.
Interpretation is contested. The widely used Landis and Koch labels call 0.61 to 0.80 substantial and 0.81 to 1.00 almost perfect. McHugh (2012) argues those labels are too lenient for health research and treats anything below 0.60 as inadequate, and she notes that many texts ask for at least 80% raw agreement.
Before you code the full dataset, define the categories, train the raters on a practice set, and double-code a subset. Then report which statistic you used, how much material two people coded, and how you settled disagreements. If a single person repeats the coding, that is intra-rater reliability, a separate check (McHugh, 2012).
Parallel forms and split-half reliability: when they apply
Parallel-forms reliability correlates scores from two equivalent versions of a test. It suits designs that need a pre-test and post-test that are not identical, but it can nearly double development cost (Morrison, 2019). Split-half reliability divides the items into two halves, correlates them and corrects for length with the Spearman-Brown formula (Morrison, 2019). It is not appropriate for a test that measures several constructs (Teesside University, n.d.).
How to check validity: build evidence instead of hunting for one number
Validity is not a coefficient you calculate once. You argue for it with several kinds of evidence. The Standards for Educational and Psychological Testing list five sources: test content, response processes, internal structure, relations to other variables and consequences of testing (AERA, APA and NCME, 2014). Heale and Twycross (2015) condense this to the three types students meet most often: content, construct and criterion validity.
Frameworks differ in how they group the evidence. Health researchers using COSMIN treat face validity as part of content validity, and structural validity and hypothesis testing as parts of construct validity (Mokkink et al., 2010). Name the framework you follow in your methodology chapter, then stick to it.
Content validity and face validity: expert review and the content validity index
Content validity asks whether your items cover the whole construct and nothing irrelevant. A workplace-stress scale that only asks about workload, for example, leaves out relationships, role clarity and job security, so its coverage is thin. If you are unsure how to approach this, read our guide to doing content analysis for a dissertation.
To check it, write a short definition of the construct, then ask a panel of experts to rate each item’s relevance on a four-point scale. The item-level content validity index (I-CVI) is the share of experts who rate an item 3 or 4. Lynn (1986) advised at least three experts. Polit, Beck and Owen (2007) suggest an I-CVI of 0.78 or higher for panels of three or more, and Polit and Beck (2006) recommend a scale-level average of 0.90 or higher. Sources differ for very small panels, so confirm the cut-off your department prefers and say whether you report the average or the universal-agreement version.
Face validity is whether the measure looks right to respondents. It is the weakest form and does not count as evidence on its own, but a pilot is a cheap way to find items that confuse or put people off.
Construct validity: factor analysis, convergent and discriminant evidence
Construct validity asks whether the instrument captures the abstract concept you claim to study. Heale and Twycross (2015) describe three kinds of evidence: homogeneity, meaning the instrument measures one construct; convergence with similar instruments; and theory evidence, meaning scores behave as theory predicts.
For internal structure, run exploratory factor analysis (EFA) when you are developing or adapting a scale, and confirmatory factor analysis (CFA) when you are testing a structure that theory already specifies. Before an EFA, check that the data suit it. A common rule of thumb treats a Kaiser-Meyer-Olkin (KMO) value below about 0.5 as unacceptable, many studies use 0.60 as a working minimum, and Bartlett’s test of sphericity should be significant. Then read the loadings: rules of thumb look for target loadings above about 0.5 and cross-loadings below about 0.3.
Convergent evidence means your scale correlates with an established measure of the same or a related construct. Discriminant evidence means it correlates weakly with measures of unrelated constructs. A new academic-burnout scale, for example, should track an established exhaustion measure more closely than it tracks an unrelated trait. Write the predicted pattern down before you run anything, then pick the right test with the help of choosing a statistical test.
If your design uses structural equation modelling, your supervisor may also expect average variance extracted (AVE) and a discriminant check such as the Fornell-Larcker criterion or HTMT.
Criterion validity: concurrent and predictive evidence
Criterion validity compares your scores with an outside benchmark. Concurrent evidence uses a benchmark measured at the same time. Predictive evidence uses an outcome measured later. A self-efficacy score, for instance, should predict whether people go on to finish a task (Heale and Twycross, 2015).
Most student scales have no true gold standard, so convergent evidence usually does the job. Clinical and diagnostic measures differ. With a reference standard, you report sensitivity, specificity and predictive values, plus a receiver operating characteristic (ROC) curve, where an area under the curve (AUC) of 1.0 is perfect and 0.5 is no better than chance (Foxman, 2011). Predictive values shift with prevalence, so describe your population.
Internal and external validity: validity of the study design
Internal and external validity describe the study, not the instrument. Internal validity is confidence that the relationship you tested is trustworthy and not driven by other factors. External validity is how far results apply to other people and settings (Teesside University, n.d.). Tight control tends to raise the first and lower the second, so describe your sampling and context well enough for readers to judge how far the findings travel.
Benchmarks at a glance: reliability and validity statistics
| Statistic | Use it for | Common benchmark | Caveat |
|---|---|---|---|
| Cronbach’s alpha | Items in one scale | 0.70 to 0.95 often cited as acceptable; above 0.90 may signal redundancy (Tavakol and Dennick, 2011) | Depends on item count and dimensionality; 0.70 is a convention (Taber, 2018) |
| ICC | Test-retest, continuous ratings | Below 0.50 poor; 0.50 to 0.75 moderate; 0.75 to 0.90 good; above 0.90 excellent (Koo and Li, 2016) | Judge by the 95% confidence interval and state the ICC form |
| Cohen’s kappa | Two raters, categories | Landis and Koch: 0.61 to 0.80 substantial. McHugh: below 0.60 inadequate (McHugh, 2012) | The scales disagree, so justify the one you use |
| Content validity index | Expert ratings of item relevance | Item level 0.78 or higher; scale average 0.90 or higher (Polit, Beck and Owen, 2007; Polit and Beck, 2006) | Sources differ for panels of three to five experts |
| KMO measure | Data suitability for factor analysis | Below about 0.5 unacceptable; about 0.60 a common working minimum | Rules of thumb vary; report Bartlett’s test too |
Pilot study: the cheapest place to check reliability and validity
A pilot tests your instrument and procedures on a small group before the main study. For a questionnaire, give it to eligible participants in the same way you will in the main study, ask what confused them, record how long it takes, and reword or drop ambiguous items. You can also calculate alpha from the pilot data and compare your questionnaire with an established one to gather early construct or criterion evidence (University of Nottingham, n.d.).
Treat pilot alpha as a screening result, not your final evidence. Small samples make estimates less stable, and alpha should be recalculated every time the instrument is administered (Tavakol and Dennick, 2011). Published advice on pilot size varies, so agree a number with your supervisor and justify it.
Keep a record of every change and the reason for it, because the methodology chapter should show how the pilot shaped the instrument. Check whether your ethics approval covers the pilot as well; getting ethics approval for a dissertation explains the usual route.
Reliability and validity in qualitative research: trustworthiness instead
Alpha and kappa were built for measurement. Qualitative work usually draws on Lincoln and Guba’s (1985) four criteria of trustworthiness, which run parallel to the quantitative terms.
| Quantitative idea | Lincoln and Guba criterion | Techniques you can name |
|---|---|---|
| Internal validity | Credibility | Prolonged engagement, persistent observation, triangulation, peer debriefing, negative case analysis, member checking |
| External validity | Transferability | Thick description of the context, so readers can judge fit |
| Reliability | Dependability | An audit trail of research and coding decisions |
| Objectivity | Confirmability | Reflexivity, and findings traceable back to raw data |
Guba and Lincoln later added authenticity as a fifth criterion. Whichever set you use, name only the techniques you actually carried out. Member checking and triangulation count toward credibility only if you did them.
Coding is where students most often mix paradigms. Clarke and Braun (2019) separate coding-reliability approaches, which use a codebook, several independent coders and agreement statistics, from reflexive thematic analysis, where coding is interpretive and inter-rater scores are not used. Their reviewer guidelines list claiming reflexive analysis while reporting kappa as conceptual confusion, and Braun and Clarke (2020) argue that coding-reliability measures cannot serve as a universal quality standard. State which tradition you follow and why.
For the analysis steps, see doing thematic analysis for a dissertation. For credibility during data collection, designing and running semi-structured interviews is the place to start.
How to write reliability and validity in your methodology chapter
Place the evidence where you describe each instrument, after you introduce the measure and before the analysis plan. Check your department’s template, because some prefer a short subsection per instrument, and writing the methodology chapter covers the wider structure.
Examiners read a bare claim such as “the scale is validated” sceptically. They look for five things:
- The instrument, its source, and what the original validation reported.
- Every change you made, such as dropped items, altered wording, translation or a new population, and why.
- Reliability in your own sample: the coefficient, its type, the subscale, the number of items and the number of respondents.
- The validity evidence you gathered, with figures: expert panel results, factor analysis, correlations with related measures.
- What you did not test, stated as a limitation.
Adapted scales need the most care. COSMIN treats cross-cultural validity as its own property, asking whether the items on a translated or culturally adapted instrument perform like the original (Mokkink et al., 2010). Reassess instead of assuming earlier validation carries over.
Example wording, with placeholders for your own results:
Job satisfaction was measured with the [number]-item [scale name] (Author, Year), which reported α = [value] in its validation sample. Because [change made], reliability was recalculated in this sample: α = [value] for [subscale one] and α = [value] for [subscale two] (n = [number]). [Number] subject experts rated item relevance, giving an I-CVI range of [range] and an S-CVI/Ave of [value]. [Limitation].
Report your measurement results in the results chapter and tie them back to the methodology claim. The structure in writing a dissertation results chapter shows how to present them.
Common mistakes when checking reliability and validity
- Quoting the original alpha. Recalculate it in your sample.
- One alpha for a multi-construct scale. Calculate it per subscale.
- Assuming a higher alpha is always better. Above 0.90 can mean redundant items.
- Deleting items only to lift alpha. Drop an item when it is weak in meaning as well as in the numbers.
- Using Pearson r alone for test-retest. Report the ICC and name its form.
- Relying on percent agreement. Add kappa or the ICC.
- Calling an adapted scale “validated”. Reassess it and report what you found.
- Applying kappa to reflexive thematic analysis. Use trustworthiness criteria instead.
- Confusing design validity with construct validity. Say whether you mean the study or the instrument.
Reliability and validity FAQs
What can I do if my Cronbach’s alpha is low?
Check the data before you change the scale. A low alpha can come from few items, weak links between items or a scale that mixes several constructs (Tavakol and Dennick, 2011). Confirm that negatively worded items were reverse-coded, split the items into their intended subscales, and read the corrected item-total correlations for items that behave differently. Adding items raises alpha only when they truly measure the same construct, so rewrite ambiguous wording before the next round of data.
How is validity calculated?
It is not calculated as one figure. You gather evidence, and each type brings its own statistic: I-CVI for expert ratings, factor loadings for structure, correlations for convergent and discriminant checks, and sensitivity, specificity or AUC for diagnostic criterion validity. Then you explain what the pattern says about the way you interpret the scores.
What are the three Cs of validity?
The phrase usually points to content, construct and criterion validity, the three types Heale and Twycross (2015) describe. Other frameworks add face validity and the design-level pair of internal and external validity.
Next step: turn the checks into a plan
For each measure, write down one reliability check, one validity source and the point in your timeline when you will collect each. Unsure which test fits your data? The statistical test selector narrows the choice.
If the methodology chapter is where you are stuck, dissertation methodology help offers guidance on planning, structure and feedback on your own draft. Use any reference work according to your institution’s policy.
References for your methodology chapter
- AERA, APA and NCME (2014) Standards for Educational and Psychological Testing. Washington, DC: American Educational Research Association.
- Braun, V. and Clarke, V. (2020) ‘One size fits all? What counts as quality practice in (reflexive) thematic analysis?’, Qualitative Research in Psychology, 18(3), pp. 328-352. doi:10.1080/14780887.2020.1769238.
- Clarke, V. and Braun, V. (2019) Guidelines for reviewers and editors evaluating thematic analysis manuscripts. University of Auckland.
- Foxman, B. (2011) ‘Determining the reliability and validity and interpretation of a measure in the study populations’, in Molecular Tools and Infectious Disease Epidemiology. Elsevier, pp. 117-132. doi:10.1016/B978-0-12-374133-2.00008-3.
- Heale, R. and Twycross, A. (2015) ‘Validity and reliability in quantitative studies’, Evidence-Based Nursing, 18(3), pp. 66-67. doi:10.1136/eb-2015-102129.
- Koo, T.K. and Li, M.Y. (2016) ‘A guideline of selecting and reporting intraclass correlation coefficients for reliability research’, Journal of Chiropractic Medicine, 15(2), pp. 155-163. doi:10.1016/j.jcm.2016.02.012.
- Lincoln, Y.S. and Guba, E.G. (1985) Naturalistic Inquiry. Beverly Hills, CA: SAGE.
- Lynn, M.R. (1986) ‘Determination and quantification of content validity’, Nursing Research, 35(6), pp. 382-385. doi:10.1097/00006199-198611000-00017.
- McHugh, M.L. (2012) ‘Interrater reliability: the kappa statistic’, Biochemia Medica, 22(3), pp. 276-282. doi:10.11613/BM.2012.031.
- McNeish, D. (2018) ‘Thanks coefficient alpha, we’ll take it from here’, Psychological Methods, 23(3), pp. 412-433. doi:10.1037/met0000144.
- Mokkink, L.B. et al. (2010) ‘The COSMIN study reached international consensus on taxonomy, terminology, and definitions of measurement properties for health-related patient-reported outcomes’, Journal of Clinical Epidemiology, 63(7), pp. 737-745. doi:10.1016/j.jclinepi.2010.02.006.
- Morrison, J. (2019) ‘Assessing questionnaire reliability’, Select Statistical Consultants blog, 30 May. Accessed 9 November 2026.
- Polit, D.F. (2014) ‘Getting serious about test-retest reliability: a critique of retest research and some recommendations’, Quality of Life Research, 23(6).
- Polit, D.F. and Beck, C.T. (2006) ‘The content validity index: are you sure you know what’s being reported? Critique and recommendations’, Research in Nursing & Health, 29(5), pp. 489-497. doi:10.1002/nur.20147.
- Polit, D.F., Beck, C.T. and Owen, S.V. (2007) ‘Is the CVI an acceptable indicator of content validity? Appraisal and recommendations’, Research in Nursing & Health, 30(4), pp. 459-467. doi:10.1002/nur.20199.
- Sauro, J. (2015) ‘How to measure the reliability of your methods and metrics’, MeasuringU blog, 7 April. Accessed 9 November 2026.
- Sheffield Hallam University (n.d.) ‘Reliability and validity’, Dissertations and research projects. LibGuides. Accessed 9 November 2026.
- Stensen, K. and Lydersen, S. (2022) ‘Internal consistency: from alpha to omega?’, Tidsskrift for Den norske legeforening. doi:10.4045/tidsskr.22.0112.
- Taber, K.S. (2018) ‘The use of Cronbach’s alpha when developing and reporting research instruments in science education’, Research in Science Education, 48(6), pp. 1273-1296. doi:10.1007/s11165-016-9602-2.
- Tavakol, M. and Dennick, R. (2011) ‘Making sense of Cronbach’s alpha’, International Journal of Medical Education, 2, pp. 53-55. doi:10.5116/ijme.4dfb.8dfd.
- Teesside University (n.d.) ‘Reliability and validity’, Quantitative data collection and analysis. LibGuides. Accessed 9 November 2026.
- University of Nottingham (n.d.) ‘Pilot testing’, Validating questionnaires. Accessed 9 November 2026.